
REDNEEDLE
A macOS System Monitor That Remembers What Happened
「何が起きたか」を記録するmacOS用システムモニター
Overview
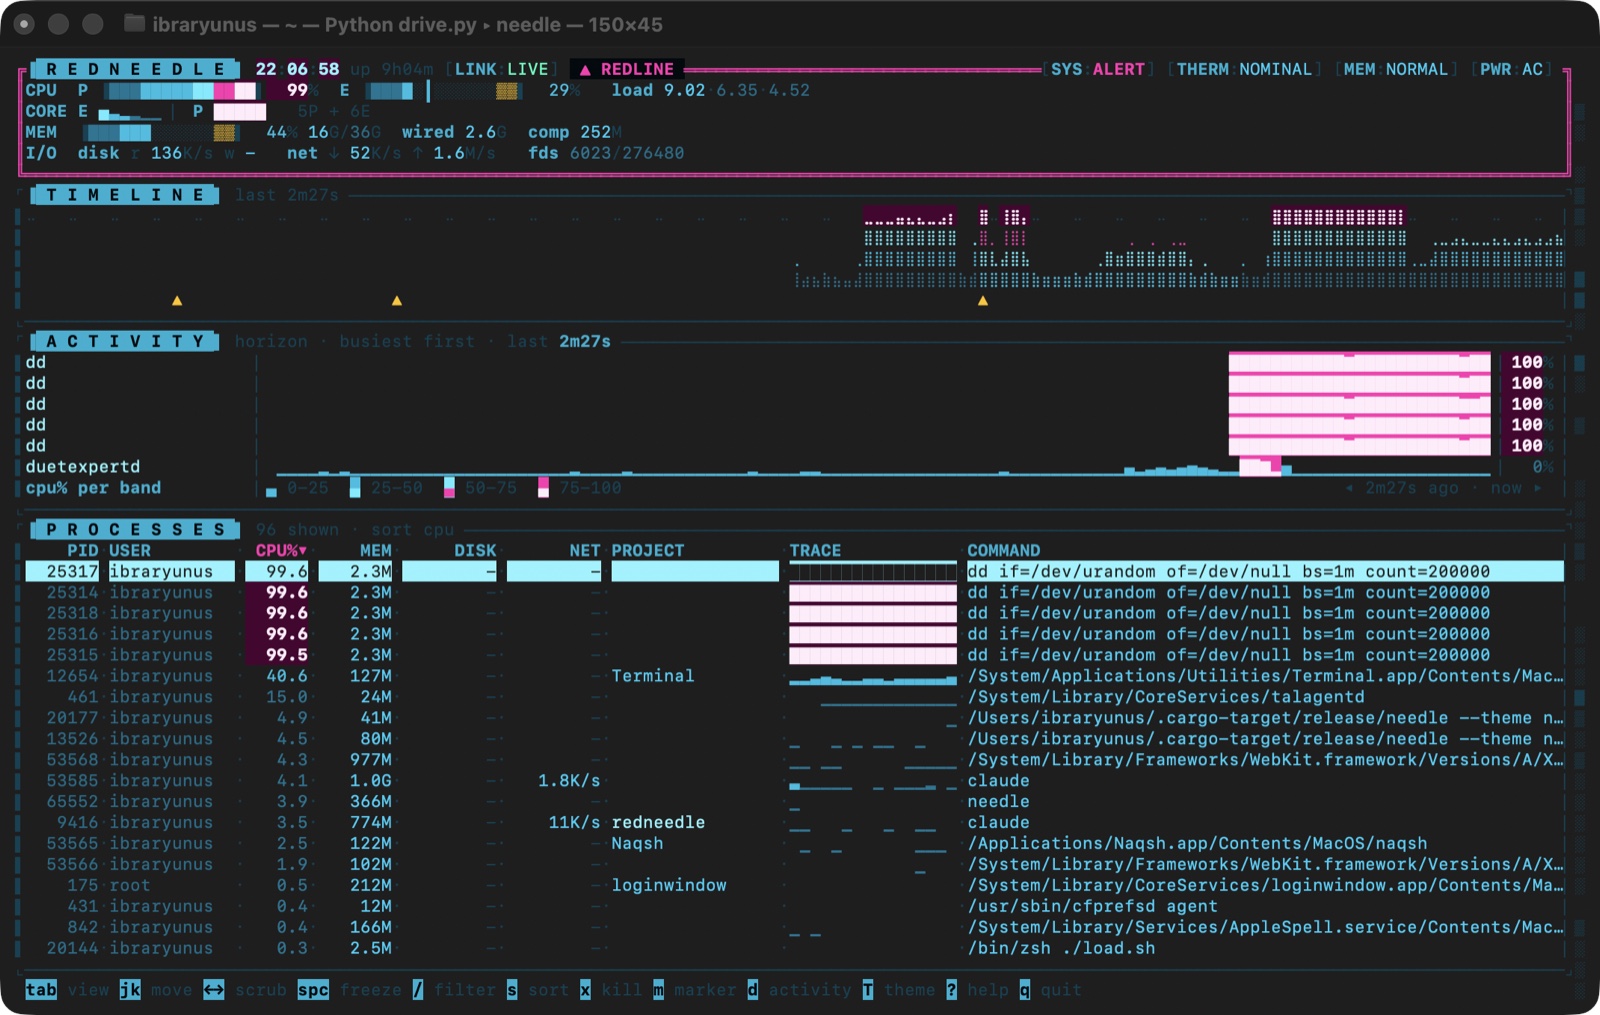
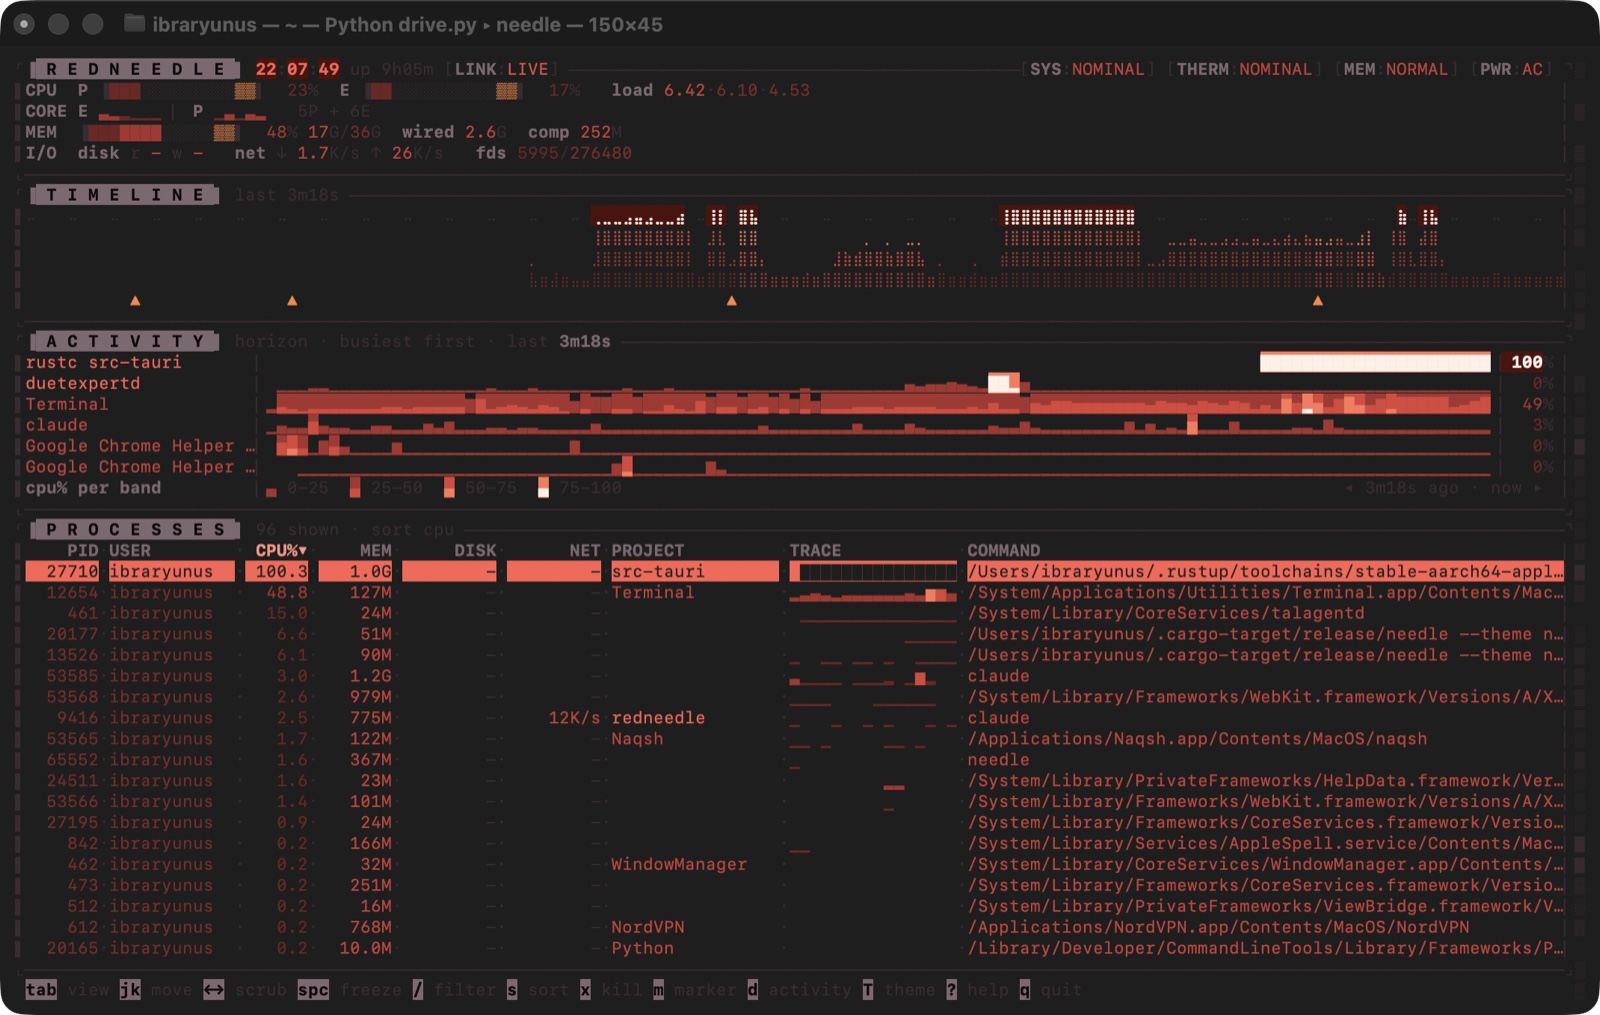
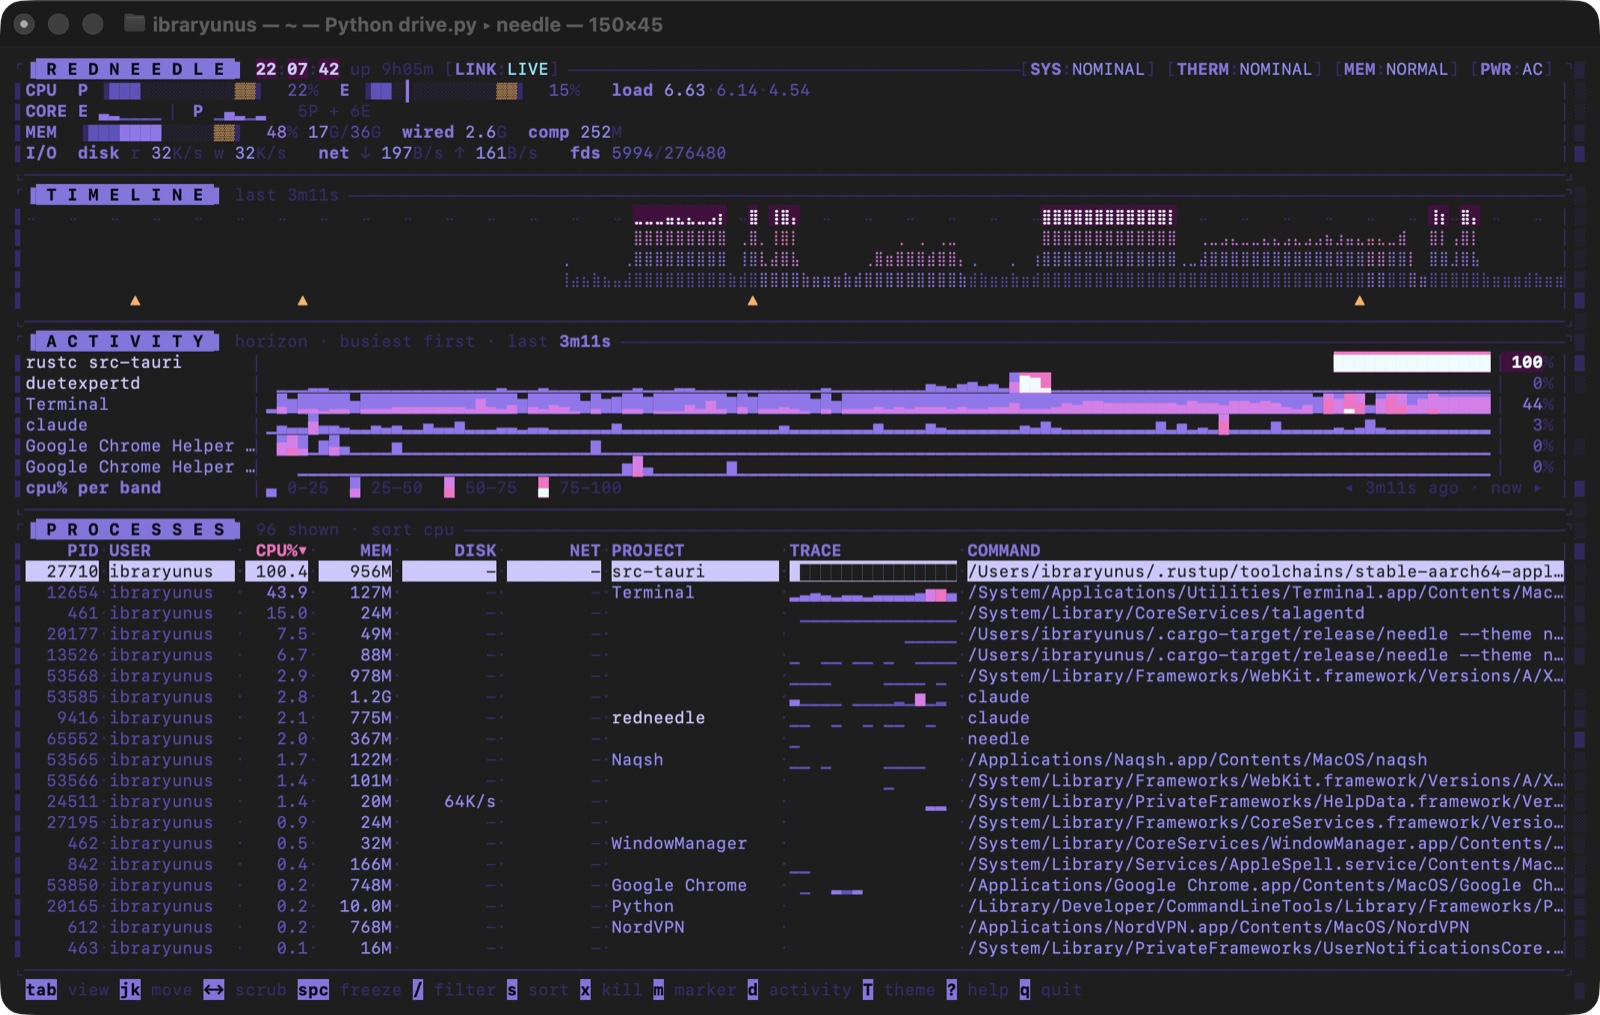
概要htop only shows you now. You look up after the fan has spun down and the process that caused it has already exited. redneedle keeps every sample, so you can scrub the timeline backwards and watch the process table re-render as it was at that second — with the spike already annotated by the process that caused it.
htopが見せるのは「今」だけです。ファンが静かになってから画面を見ても、原因のプロセスはもう終了しています。redneedleはすべてのサンプルを保存するため、タイムラインを巻き戻して、その瞬間のプロセス一覧をそのまま再表示できます。負荷の急上昇には、原因となったプロセス名があらかじめ記録されています。
Every monitor I had been using answered the wrong question. The fans spin up, you switch to the terminal, and by the time htop has painted its first frame the thing that caused it has exited and taken the answer with it. The second half of the problem is that these tools are built for servers: a dev machine is a machine where forty of the running processes are called node, where the interesting fact about a process is which checkout it belongs to and which port it is holding, and where the question after a slow build is whether the build grew or the laptop was being thermally throttled. Neither half is exotic. Both are invisible in every tool I had open.
これまで使ってきたモニターは、どれも的外れな問いに答えていました。ファンが回り始めてターミナルを開き、htopが最初の画面を描く頃には、原因のプロセスは答えごと消えています。もう一つの問題は、こうしたツールがサーバー向けに作られていることです。開発マシンでは40個のプロセスがすべて「node」という名前で、知りたいのはそのプロセスがどのリポジトリのもので、どのポートを使っているかです。ビルドが遅いときに知りたいのは、ビルドが重くなったのか、それともマシンが熱で速度を落とされていたのかです。どちらも特殊な要求ではありませんが、手元のどのツールでも見えませんでした。
How it was built
開発The design brief was an instrument panel rather than a dashboard, and one rule did most of the work: the casing is cold and the data is warm. Chrome — brackets, rails, column heads, the gutter — never carries a value, so it stays exactly the same whatever the machine is doing; the data family owns the warm end of the palette outright, which is what makes a gauge look lit rather than drawn. Inside that family, heat is carried by brightness within a single hue rather than by switching colours, so the display reads as one instrument rather than a traffic light — and the only thing on screen that is not the theme hue is a value past the redline, which is exactly what should catch your eye.
目指したのはダッシュボードではなく計器盤で、一つのルールが設計の大半を決めました。「筐体は冷たく、データは温かく」。括弧、レール、列見出し、余白といった枠の部分は値を一切持たず、マシンの状態に関係なく常に同じ見た目です。暖色系の色はすべてデータ専用にしたことで、ゲージが描かれたものではなく光っているように見えます。熱さは色を切り替えるのではなく、一つの色相の明るさで表現するため、画面は信号機ではなく一つの計器として読めます。テーマ色以外で表示されるのはレッドラインを超えた値だけで、それこそが目に留まるべきものです。
What it does
機能Every sample is kept — thirty minutes by default. ← and → walk backwards and the whole UI re-renders as it was at that instant, process table included; space freezes, home returns to live. A process that appears in a scrubbed frame but has since exited has its command line degraded into static, because what you are looking at is a recording rather than a reading and the table should say so without a legend.
すべてのサンプルを保存します(標準で30分)。←と→で時間をさかのぼると、プロセス一覧を含む画面全体がその瞬間の状態で再表示されます。スペースで一時停止、Homeでライブに戻ります。巻き戻した画面に映っていても既に終了したプロセスは、コマンド名がノイズ状に崩れて表示されます。見ているのが記録であることを、凡例なしで伝えるためです。
When CPU crosses the redline, thermal pressure changes, memory pressure changes, the machine starts swapping in, or file descriptors approach the kernel limit, redneedle writes a marker at that instant along with the process responsible. After the fact that process is usually gone — this is the only moment the information exists. m and M jump between them.
CPUがレッドラインを超えたとき、熱プレッシャーやメモリプレッシャーが変化したとき、スワップインが始まったとき、ファイルディスクリプタがカーネルの上限に近づいたとき、その瞬間に原因のプロセスとともにマーカーを記録します。後から見る頃にはそのプロセスはたいてい消えているため、情報が存在するのはこの瞬間だけです。mとMでマーカー間を移動できます。
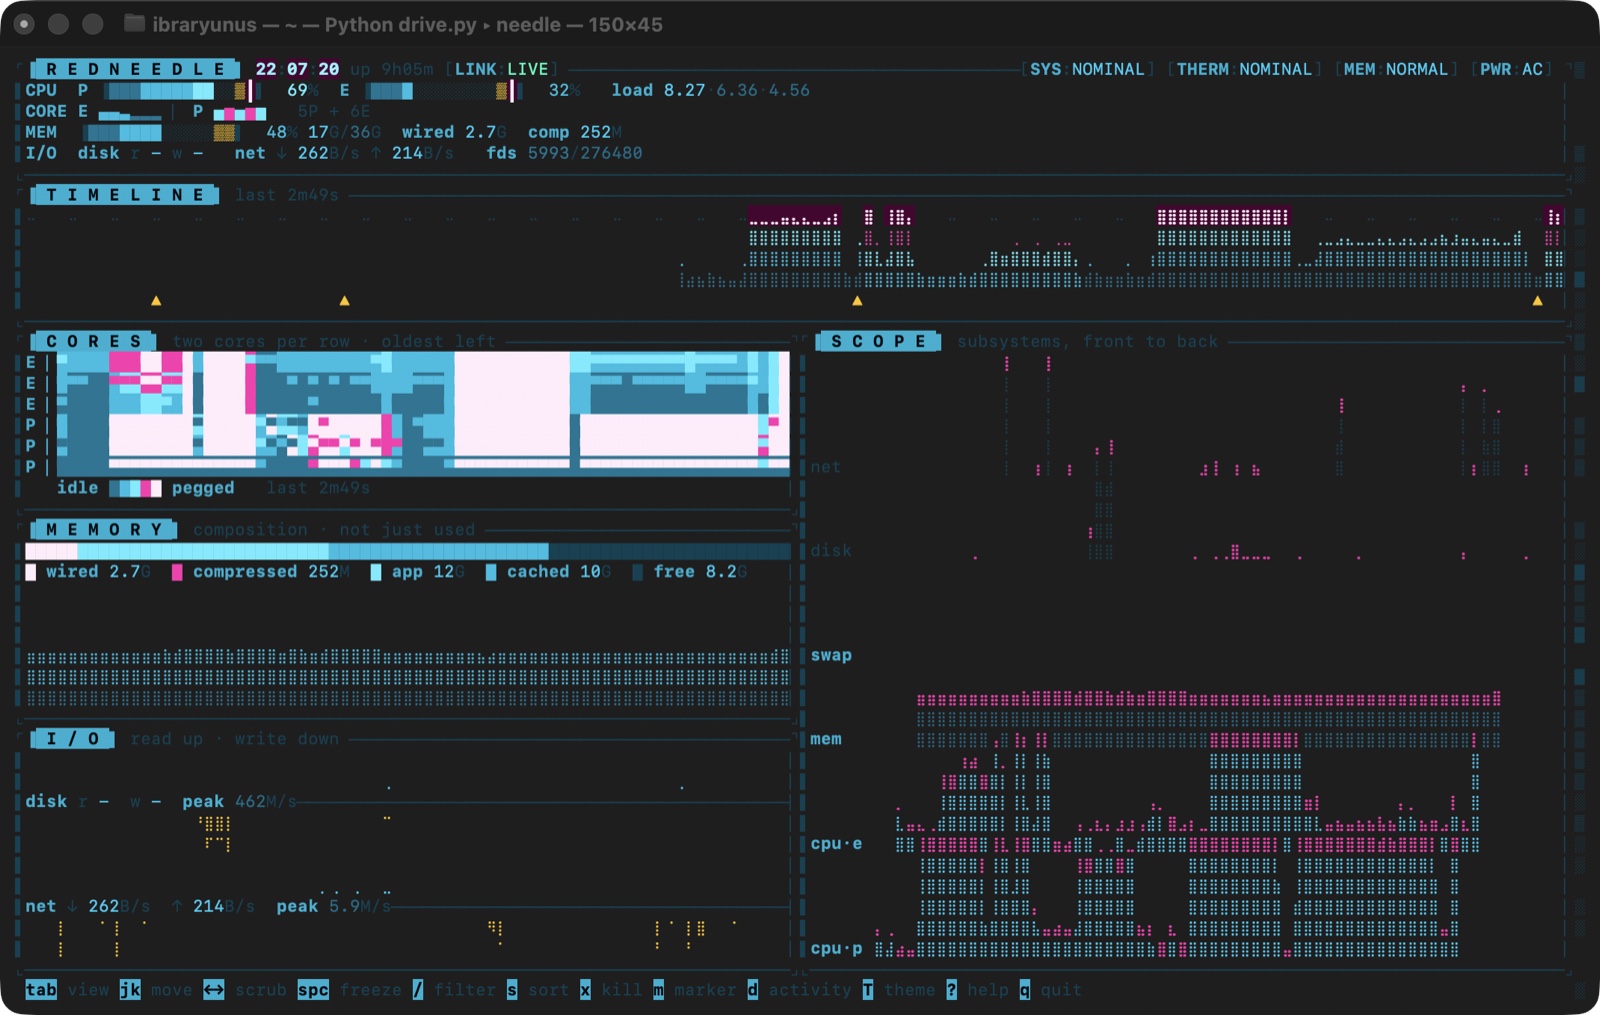
On Apple Silicon a pegged efficiency cluster is a healthy idle and a pegged performance cluster is not. One averaged CPU number cannot tell the two apart, so the header carries them as separate gauges and the scope draws a core waterfall — two cores per terminal row, upper in the foreground of a half-block and lower in its background — because four cores pinned and seven idle averages to the same figure as everything at forty percent, and the two mean completely different things.
Apple Siliconでは、効率コアが張り付いているのは正常なアイドル状態ですが、性能コアが張り付いているのはそうではありません。CPU使用率を平均した一つの数字では区別できないため、ヘッダーには別々のゲージを並べ、コアごとの推移も描画します。4コアが全開で7コアが待機している状態と、全コアが40%の状態は平均すると同じ数字ですが、意味はまったく異なります。
macOS compresses and caches aggressively, so 22 GB used means nothing. redneedle reads the kernel's own pressure level, breaks memory into wired · compressed · app · cached · free ordered by how hard the page is to get back, and shows swap-ins per second — the number that actually correlates with the machine feeling slow. Thermal pressure gets the same treatment: a visible, recorded signal for “you are being throttled”, which explains more slow builds than any CPU graph.
macOSは積極的に圧縮とキャッシュを行うため、「22GB使用中」には意味がありません。redneedleはカーネル自身のプレッシャーレベルを読み、メモリを固定・圧縮・アプリ・キャッシュ・空きに分けて、取り戻しにくい順に並べます。さらに、体感の遅さと実際に相関する毎秒のスワップイン数を表示します。熱プレッシャーも同様に、「速度を落とされている」ことを目に見える形で記録します。遅いビルドの原因は、どのCPUグラフよりもこちらで説明できることが多いのです。
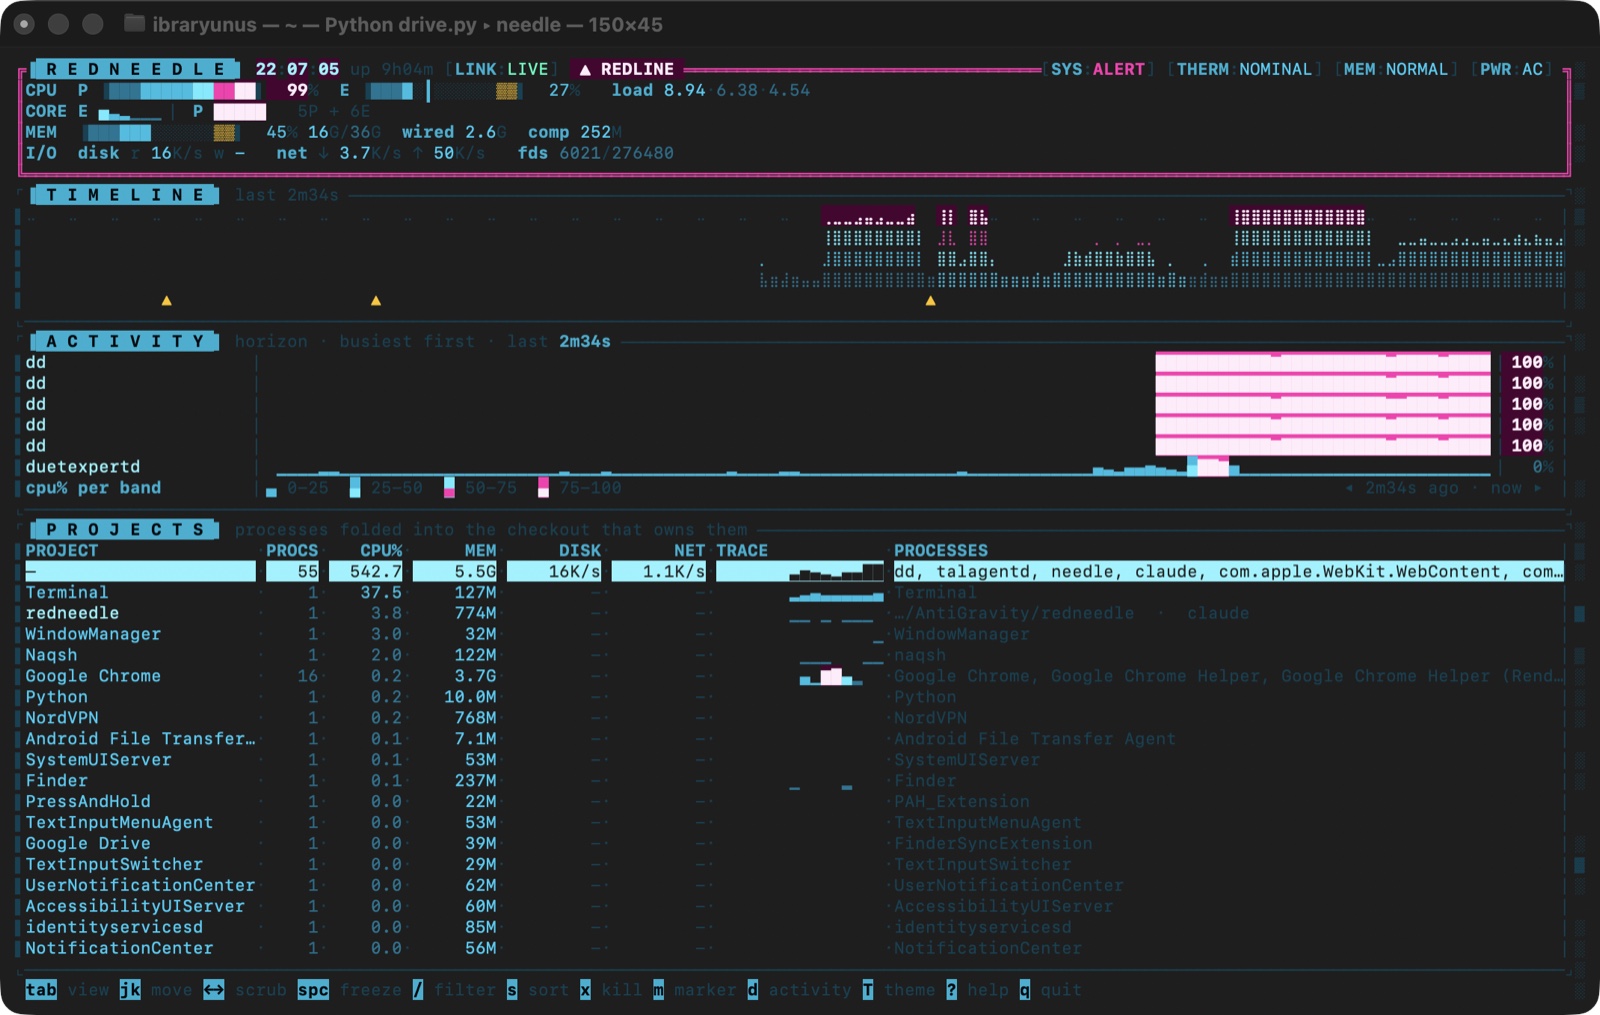
Each process's working directory is walked up to the nearest repository root, so a table of anonymous node and rustc entries becomes a list of projects. Chrome's forty helpers collapse into one row too, because .app bundles fold the same way. It is the difference between a list of processes and a list of the things you are actually doing.
各プロセスの作業ディレクトリを最も近いリポジトリのルートまでたどり、名前のないnodeやrustcの羅列をプロジェクトの一覧に変えます。.appバンドルも同じようにまとめるため、Chromeの40個のヘルパーも1行になります。プロセスの一覧ではなく、自分が今している作業の一覧になります。
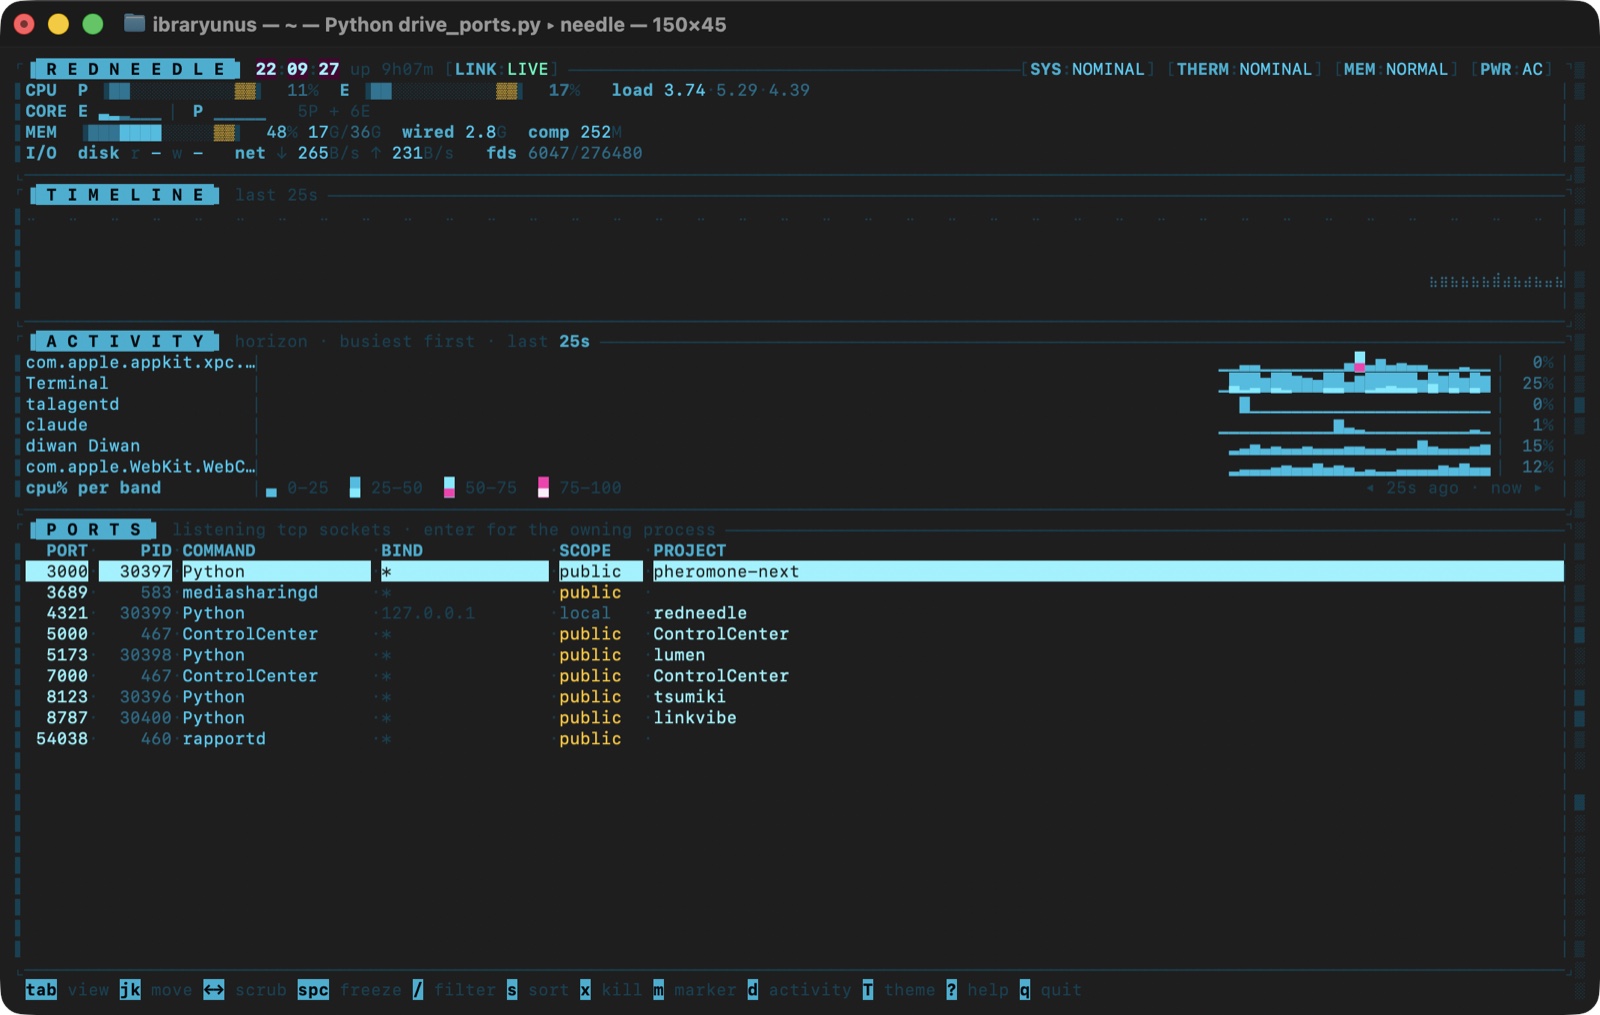
A permanent view of every listening TCP socket, the process holding it and the project it belongs to — and whether the bind is reachable from outside this machine or only from localhost, which is worth knowing about a dev server. needle ports prints the same table and exits.
待ち受け中のすべてのTCPソケットについて、使っているプロセス、所属するプロジェクト、そして外部から到達できるのかlocalhostのみなのかを常に表示します。開発サーバーでは知っておくべき情報です。needle portsで同じ表を出力して終了することもできます。
Between the timeline and the process table sits a horizon chart, the technique for many series and almost no vertical space. The value range folds into four bands stacked into a single row: colour says which band the value reached, glyph height says where inside it. Eight processes cost eight rows and still resolve to about a thirtieth of the range. Lanes are ordered by each process's peak over the window rather than by what it is doing this second — a chart whose rows move while you read it is unreadable however good the encoding is, and peak keeps whoever has just gone quiet on screen, which is usually the process you went looking for.
タイムラインとプロセス一覧の間には、多数の系列を最小限の高さで表示するホライズンチャートがあります。値の範囲を4段に折りたたんで1行に重ね、色でどの段に達したか、文字の高さで段の中の位置を示します。8つのプロセスでも8行で済み、範囲のおよそ30分の1まで見分けられます。行の並びは今この瞬間の負荷ではなく、期間中のピークの高い順です。読んでいる間に行が動くチャートは、表現がどれほど優れていても読めません。ピーク順にすることで、直前に静かになったプロセス、つまりたいてい探していたプロセスが画面に残ります。
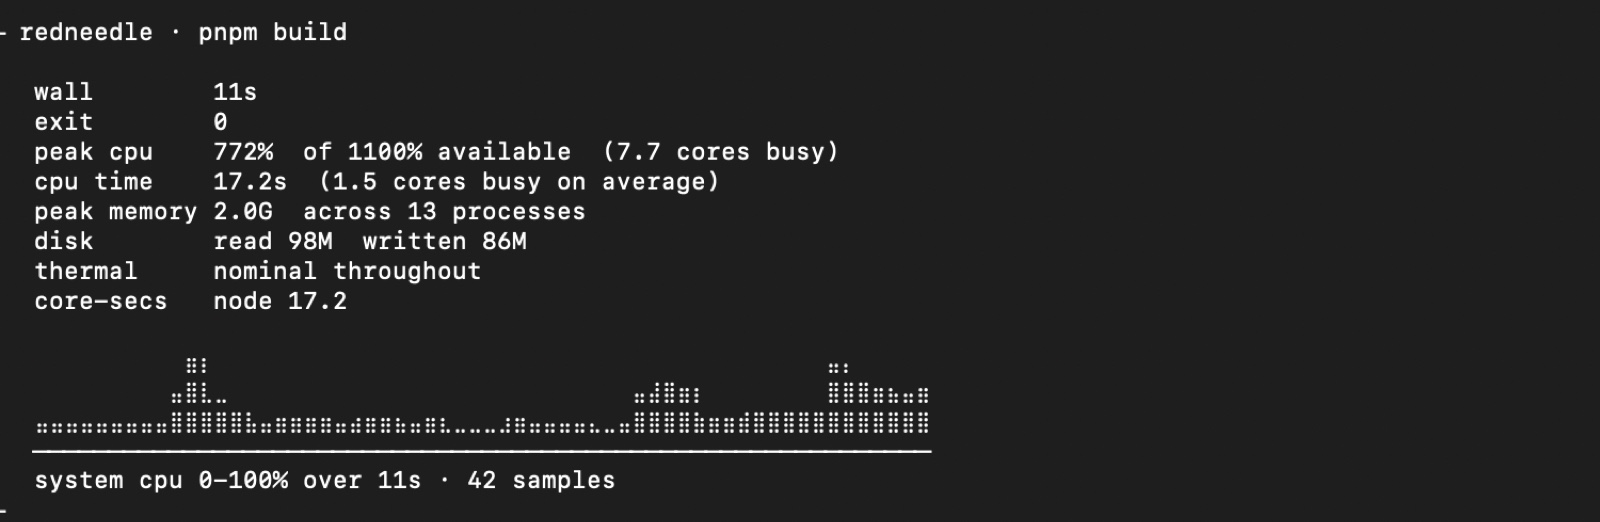
needle run -- pnpm build runs the command with stdio attached as normal, then reports wall time, peak CPU against what the machine has, cpu-time as cores busy on average, peak memory across the whole process tree, disk read and written, whether the machine was thermally throttled at any point, and core-seconds broken down per binary. Two of those answer questions nothing else will: cores busy on average is parallel efficiency — if -j 10 gives you 3.4, the flag is not doing what you think — and thermal tells you whether the build got slower or the machine did. The report goes to stderr, so stdout still belongs to the command.
needle run -- pnpm build は、通常どおり標準入出力をつないでコマンドを実行し、終了後に経過時間、マシン全体に対するCPUのピーク、平均稼働コア数、プロセスツリー全体のメモリのピーク、ディスクの読み書き量、途中で熱による速度低下があったか、バイナリ別のコア秒を報告します。他では得られない答えが2つあります。平均稼働コア数は並列効率そのもので、-j 10で3.4なら、そのオプションは期待どおりに働いていません。熱の情報は、遅くなったのがビルドなのかマシンなのかを教えてくれます。レポートは標準エラー出力に出すため、標準出力はコマンドのものです。
neon, acid, vapor, red, ember, mono and classic, cycled live with T. The cycle runs brightest to quietest so one keypress moves along a gradient rather than jumping about, mono is the automatic choice under NO_COLOR, and gradients use 24-bit colour when COLORTERM advertises it and hand-picked 256-colour indices otherwise rather than letting the terminal approximate them badly.
neon、acid、vapor、red、ember、mono、classicの7種類を、Tキーでその場で切り替えられます。明るいものから落ち着いたものへ順に並べているため、1回押すごとにグラデーションに沿って移動します。NO_COLORが設定されていればmonoを自動で選択します。COLORTERMが対応していれば24ビットカラー、そうでなければ厳選した256色のパレットを使い、ターミナルの不正確な近似に任せません。
Under the hood
技術の詳細Keeping every sample so the past is a placeすべてのサンプルを保存し、過去を「場所」にする
History is a ring of fixed-size samples rather than a stream of events, which is what makes scrubbing a lookup instead of a replay: pick an index and the entire UI — gauges, timeline, horizon chart, process table — renders from that one sample. It also means the expensive question is answered once, at capture time. Working out which process caused a redline is only possible while it is running, so the marker carries the culprit with it rather than pointing at a table that will have moved on by the time you look.
履歴はイベントの流れではなく、固定サイズのサンプルを並べたリングバッファです。そのため巻き戻しは再生ではなく参照になり、インデックスを一つ選ぶだけで、ゲージ、タイムライン、ホライズンチャート、プロセス一覧という画面全体がそのサンプルから描画されます。また、重い計算は取得時に一度だけで済みます。レッドラインの原因プロセスを特定できるのはそのプロセスが動いている間だけなので、マーカーは後で内容が変わってしまう表を指すのではなく、原因そのものを保持します。
A gauge with four things in it4つの要素を持つゲージ
Each bar is a gradient fill where every cell is coloured for the value it stands for, a peak-hold needle sitting at the highest value of the last ten seconds, a redline zone that stays marked even when empty, and a bloom past the line. The needle is the part that earns its place — a spike that came and went between glances still leaves it out ahead of the bar. The bloom is a cheat: terminals cannot blur, so a redlined cell gets the heat painted behind it as well as in it and its neighbours are drawn one ramp step hotter than they have earned, capped below the white-hot step so a halo can never be mistaken for the spike that cast it.
各バーは、値に応じて各セルを色分けしたグラデーション、直近10秒の最大値を示すピークホールドの針、空のときも表示されるレッドライン領域、そしてラインを超えたときのにじみで構成されています。特に役立つのは針で、目を離した間に起きて消えた急上昇も、バーの先に痕跡として残ります。にじみは工夫によるものです。ターミナルではぼかしが使えないため、レッドラインを超えたセルは背景にも熱の色を塗り、隣のセルも本来より1段階熱く描きます。ただし最も明るい段階の手前で止めるため、にじみが急上昇そのものと見分けられなくなることはありません。
Built for a dev machine, not a serverサーバーではなく開発マシンのために
Processes are folded into the checkout that owns them by walking each working directory up to the nearest repository root, listening ports are a permanent view with the owning project and whether the bind is public, and per-process disk and network I/O are shown at all — none of which the usual tools do on macOS. The same premise drives needle run: after a slow build the question is whether the build grew or the machine was throttling, and that is a question about the machine during those nineteen seconds, not about the machine now.
作業ディレクトリをリポジトリのルートまでたどってプロセスをまとめること、待ち受けポートを所属プロジェクトと公開範囲つきで常時表示すること、プロセス別のディスクとネットワークのI/Oを表示すること。macOSの一般的なツールは、このどれも行いません。needle runも同じ考えから生まれました。遅いビルドの後に知りたいのは、ビルドが重くなったのか、マシンが速度を落とされていたのかです。これは今のマシンではなく、その19秒間のマシンについての問いです。
Stack
技術構成Rust 2024 on ratatui and crossterm, about 6,000 lines, shipping as a single binary called needle. Readings come from where they actually live rather than from a shell-out: core topology from hw.perflevel0/1.logicalcpu, the memory breakdown from host_statistics64(HOST_VM_INFO64), memory pressure from kern.memorystatus_vm_pressure_level, thermal pressure from OSThermalNotification via notify_get_state, and fd headroom from kern.num_files against kern.maxfiles. The two things that genuinely need an external tool — lsof for listening sockets every 3s and nettop for per-process network every 2s — run on their own threads, so a sample is never blocked behind them, and both degrade silently to an empty panel if the tool is missing. GPU, Neural Engine and package wattage all require powermetrics, which is root-only; redneedle ships without a privileged helper so that one brew install is the whole setup, and the seam is left in place if that trade ever stops being worth it. Rendering is deliberately testable: the TUI is drawn through ratatui TestBackend in the suite, so layout, key handling and scrubbing are all covered without a tty, and the startup settle and view transitions are a post-pass over the finished frame rather than a separate render path — an animation that cannot drift away from what the UI actually looks like. The event loop paints at 40 ms while anything is moving and drops back to 100 ms when nothing is. Per-process CPU is sampled, so a process born and gone inside one interval is invisible in the live table; needle run works around that by diffing lifetime CPU time instead, which is what makes short-lived build steps count.
Rust 2024、ratatuiとcrossterm、約6,000行。単一のバイナリ「needle」として配布しています。値はシェルコマンドを経由せず、本来の取得元から直接読みます。コア構成はhw.perflevel0/1.logicalcpu、メモリの内訳はhost_statistics64(HOST_VM_INFO64)、メモリプレッシャーはkern.memorystatus_vm_pressure_level、熱プレッシャーはnotify_get_state経由のOSThermalNotification、ファイルディスクリプタの余裕はkern.num_filesとkern.maxfilesから取得します。外部ツールが本当に必要な2つ、3秒ごとの待ち受けソケット取得(lsof)と2秒ごとのプロセス別ネットワーク取得(nettop)は別スレッドで動かし、サンプル取得を妨げません。ツールがなければ空のパネルになるだけです。GPU、Neural Engine、消費電力はroot専用のpowermetricsが必要なため、特権ヘルパーは同梱せず、brew installだけで導入できる形を選びました。取得の仕組みは残してあるので、方針を変える場合も作り直しは不要です。描画はテストしやすい設計にしています。テストではratatuiのTestBackendでTUIを描画し、レイアウト、キー操作、巻き戻しをttyなしで検証します。起動時の演出や画面遷移は、別の描画経路ではなく完成したフレームへの後処理として実装しているため、アニメーションが実際の画面とずれることはありません。動きがある間は40ms、ない間は100ms間隔で描画します。プロセスごとのCPU使用率はサンプリングのため、1回の間隔内で生まれて消えるプロセスはライブ表示に出ません。needle runは累積CPU時間の差分を取ることでこれを補い、短時間のビルド処理も計上します。
Changelog
更新履歴- A frozen screen stays frozen: the scrub cursor was an index into a buffer that slides, so once the 30-minute history filled up, a frozen or scrubbed display silently played forward until it caught up with live.
- enter opens the process behind the selected row in every view — in the ports view that is the socket's actual owner, not whichever process sat at the same row number.
- Signals are aimed with the live sample rather than the frame on screen, so a process that has already exited — and whose pid the kernel may have recycled — cannot be signalled from a scrubbed frame.
- needle run passes the command's real exit status through (128+N for a death by signal, 127 for a command that could not start), measures wall time to the exit rather than to the end of its own sampling, writes --json to stderr so stdout still belongs to the command, and survives ctrl-c: the signal is passed on, the child is reaped, and the partial measurement is still reported.
- CPU totals now count the short-lived steps a sampler never sees, taken from the kernel's own child accounting — a build made of hundreds of sub-100ms steps was losing most of its time.
- Thread counts are real rather than always zero, a battery held at 80% no longer reports as charging, a failed nettop sweep no longer pins stale rates to a process, and CJK process and project names no longer shift every column to their right.
- Scrubbable 30-minute history — the whole UI, process table included, re-renders as it was at any second in the window.
- Event markers for CPU redline, thermal pressure, memory pressure, swap-in and file-descriptor headroom, each carrying the process responsible at the instant it was raised.
- P-core and E-core gauges kept apart, memory composition and kernel pressure level rather than "used", thermal pressure and fd headroom.
- Projects view — processes folded into the checkout that owns them; ports view — every listening TCP socket with its owner, project and whether the bind is public.
- needle run -- <cmd> reports wall, peak CPU, parallel efficiency, peak memory, disk, thermal state and per-binary core-seconds.
- Activity horizon chart, the four-panel scope, seven themes, and snapshot / json / ports modes that work over ssh and in CI.
The rule that shaped the whole thing is that the most useful fact about a spike only exists during the spike. Everything else follows from taking that seriously: keep every sample, attach the culprit to the marker at the instant it is raised, and mark a scrubbed frame as a recording so it can never be mistaken for a live reading. The name is a small piece of the same honesty: redline was the obvious one and is unusable, because it already belongs to a host-forensics product and to one of the better-known infostealer families, both of which do process and memory inspection. A monitor that shares a name with malware in the same space is a monitor nobody should install.
全体を形づくったのは、「急上昇について最も役立つ情報は、急上昇している間にしか存在しない」という考えです。これを真剣に受け止めると、残りは自然に決まります。すべてのサンプルを保存する。マーカーには記録した瞬間の原因プロセスを添える。巻き戻した画面は記録であることを明示し、ライブの値と取り違えないようにする。名前も同じ考えから選びました。「redline」が最も自然な候補でしたが、既にホストのフォレンジック製品と、よく知られた情報窃取マルウェアの名前として使われており、どちらもプロセスやメモリを調べるものです。同じ分野のマルウェアと同じ名前のモニターは、誰にもインストールされるべきではありません。