REDNEEDLE
A macOS System Monitor That Remembers What Happened
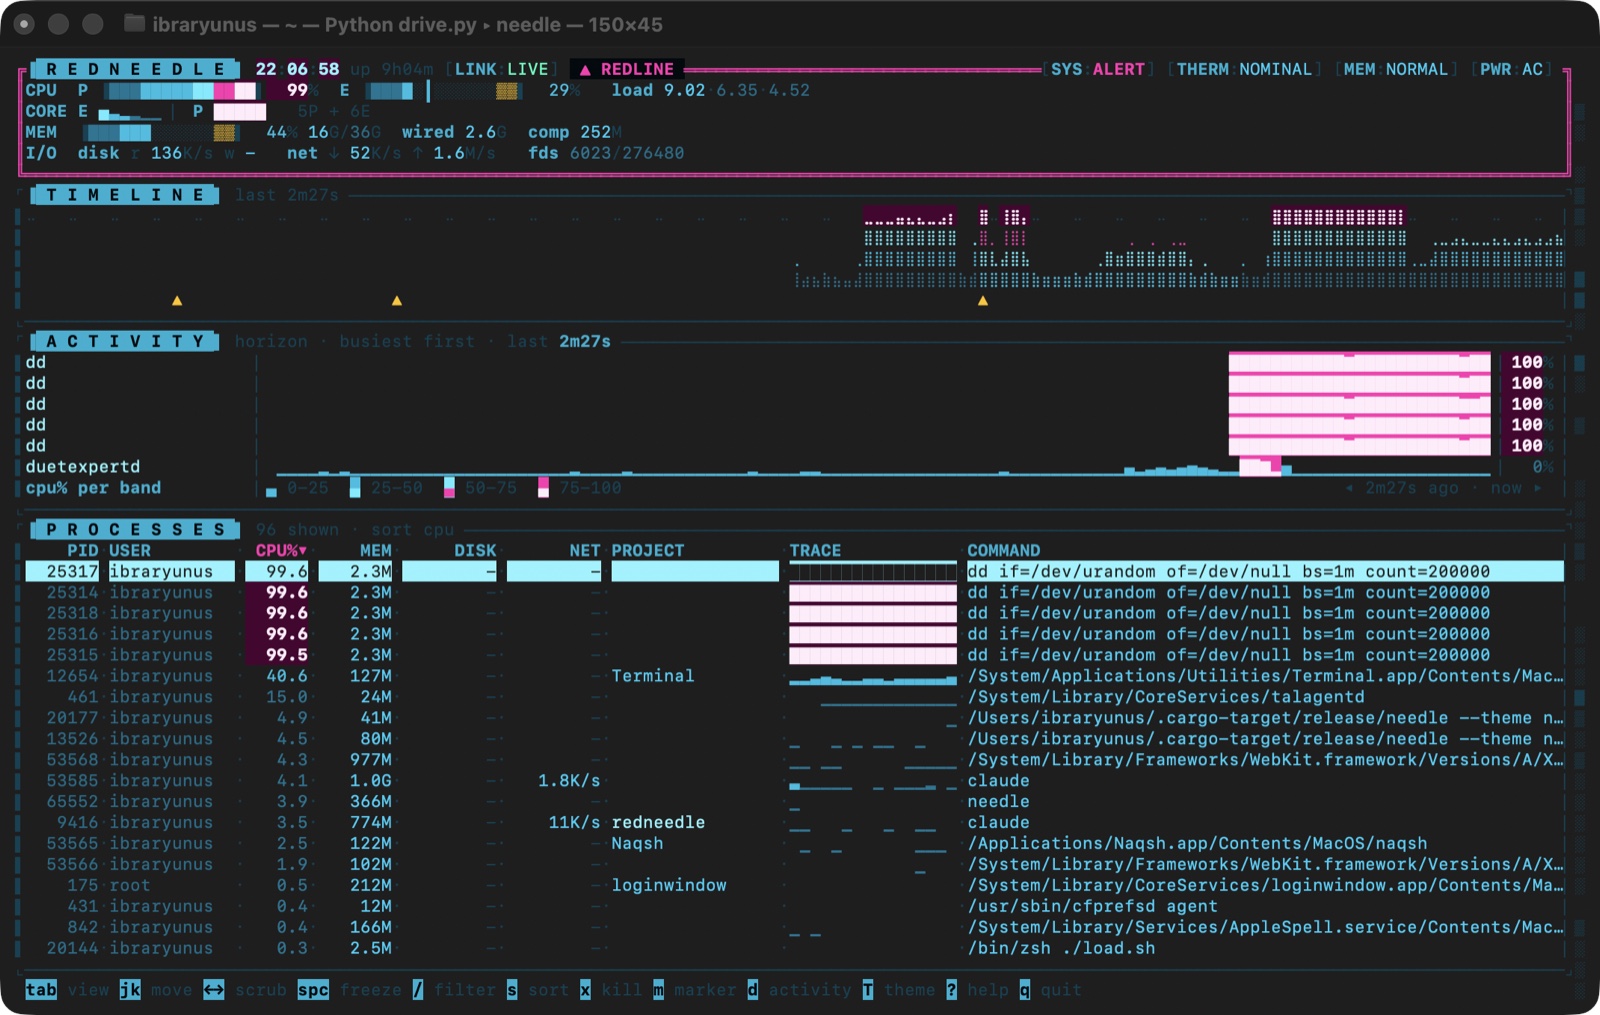
htop only shows you now. You look up after the fan has spun down and the process that caused it has already exited. redneedle keeps every sample, so you can scrub the timeline backwards and watch the process table re-render as it was at that second — with the spike already annotated by the process that caused it.
Origin Story開発の背景
Every monitor I had been using answered the wrong question. The fans spin up, you switch to the terminal, and by the time htop has painted its first frame the thing that caused it has exited and taken the answer with it. The second half of the problem is that these tools are built for servers: a dev machine is a machine where forty of the running processes are called node, where the interesting fact about a process is which checkout it belongs to and which port it is holding, and where the question after a slow build is whether the build grew or the laptop was being thermally throttled. Neither half is exotic. Both are invisible in every tool I had open.
How It's Builtつくり方
The design brief was an instrument panel rather than a dashboard, and one rule did most of the work: the casing is cold and the data is warm. Chrome — brackets, rails, column heads, the gutter — never carries a value, so it stays exactly the same whatever the machine is doing; the data family owns the warm end of the palette outright, which is what makes a gauge look lit rather than drawn. Inside that family, heat is carried by brightness within a single hue rather than by switching colours, so the display reads as one instrument rather than a traffic light — and the only thing on screen that is not the theme hue is a value past the redline, which is exactly what should catch your eye.
Engineering Notesエンジニアリングノート
Keeping every sample so the past is a place
History is a ring of fixed-size samples rather than a stream of events, which is what makes scrubbing a lookup instead of a replay: pick an index and the entire UI — gauges, timeline, horizon chart, process table — renders from that one sample. It also means the expensive question is answered once, at capture time. Working out which process caused a redline is only possible while it is running, so the marker carries the culprit with it rather than pointing at a table that will have moved on by the time you look.
A gauge with four things in it
Each bar is a gradient fill where every cell is coloured for the value it stands for, a peak-hold needle sitting at the highest value of the last ten seconds, a redline zone that stays marked even when empty, and a bloom past the line. The needle is the part that earns its place — a spike that came and went between glances still leaves it out ahead of the bar. The bloom is a cheat: terminals cannot blur, so a redlined cell gets the heat painted behind it as well as in it and its neighbours are drawn one ramp step hotter than they have earned, capped below the white-hot step so a halo can never be mistaken for the spike that cast it.
Built for a dev machine, not a server
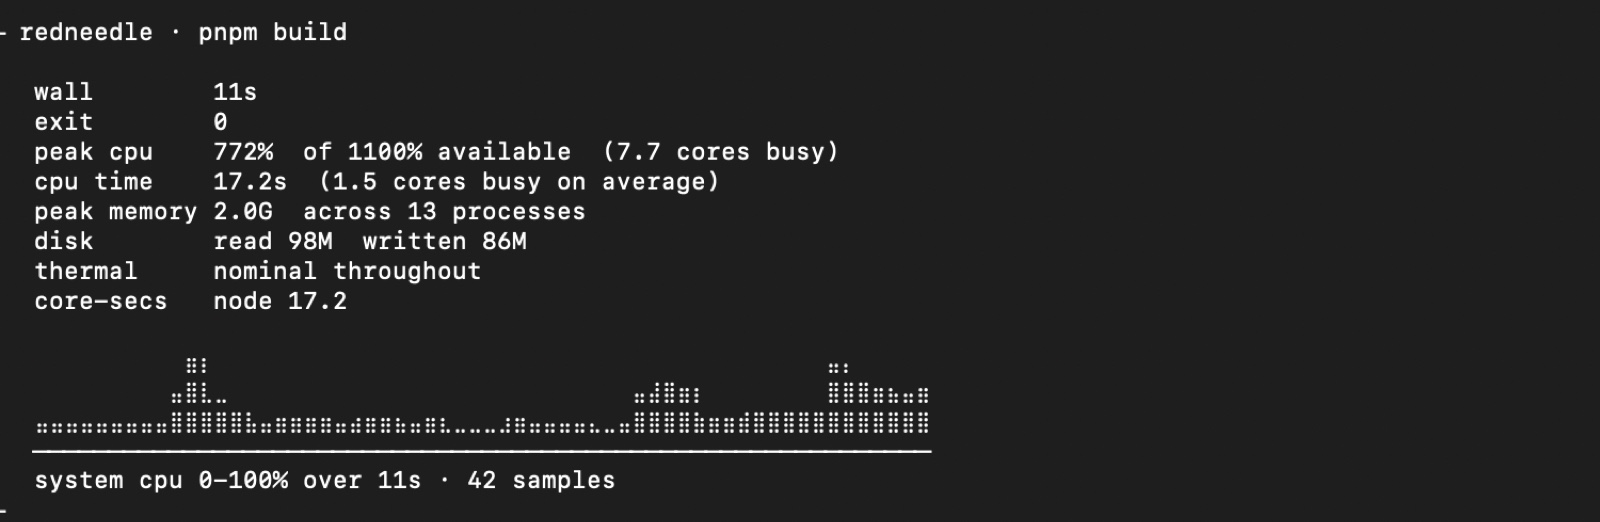
Processes are folded into the checkout that owns them by walking each working directory up to the nearest repository root, listening ports are a permanent view with the owning project and whether the bind is public, and per-process disk and network I/O are shown at all — none of which the usual tools do on macOS. The same premise drives needle run: after a slow build the question is whether the build grew or the machine was throttling, and that is a question about the machine during those nineteen seconds, not about the machine now.
Galleryギャラリー
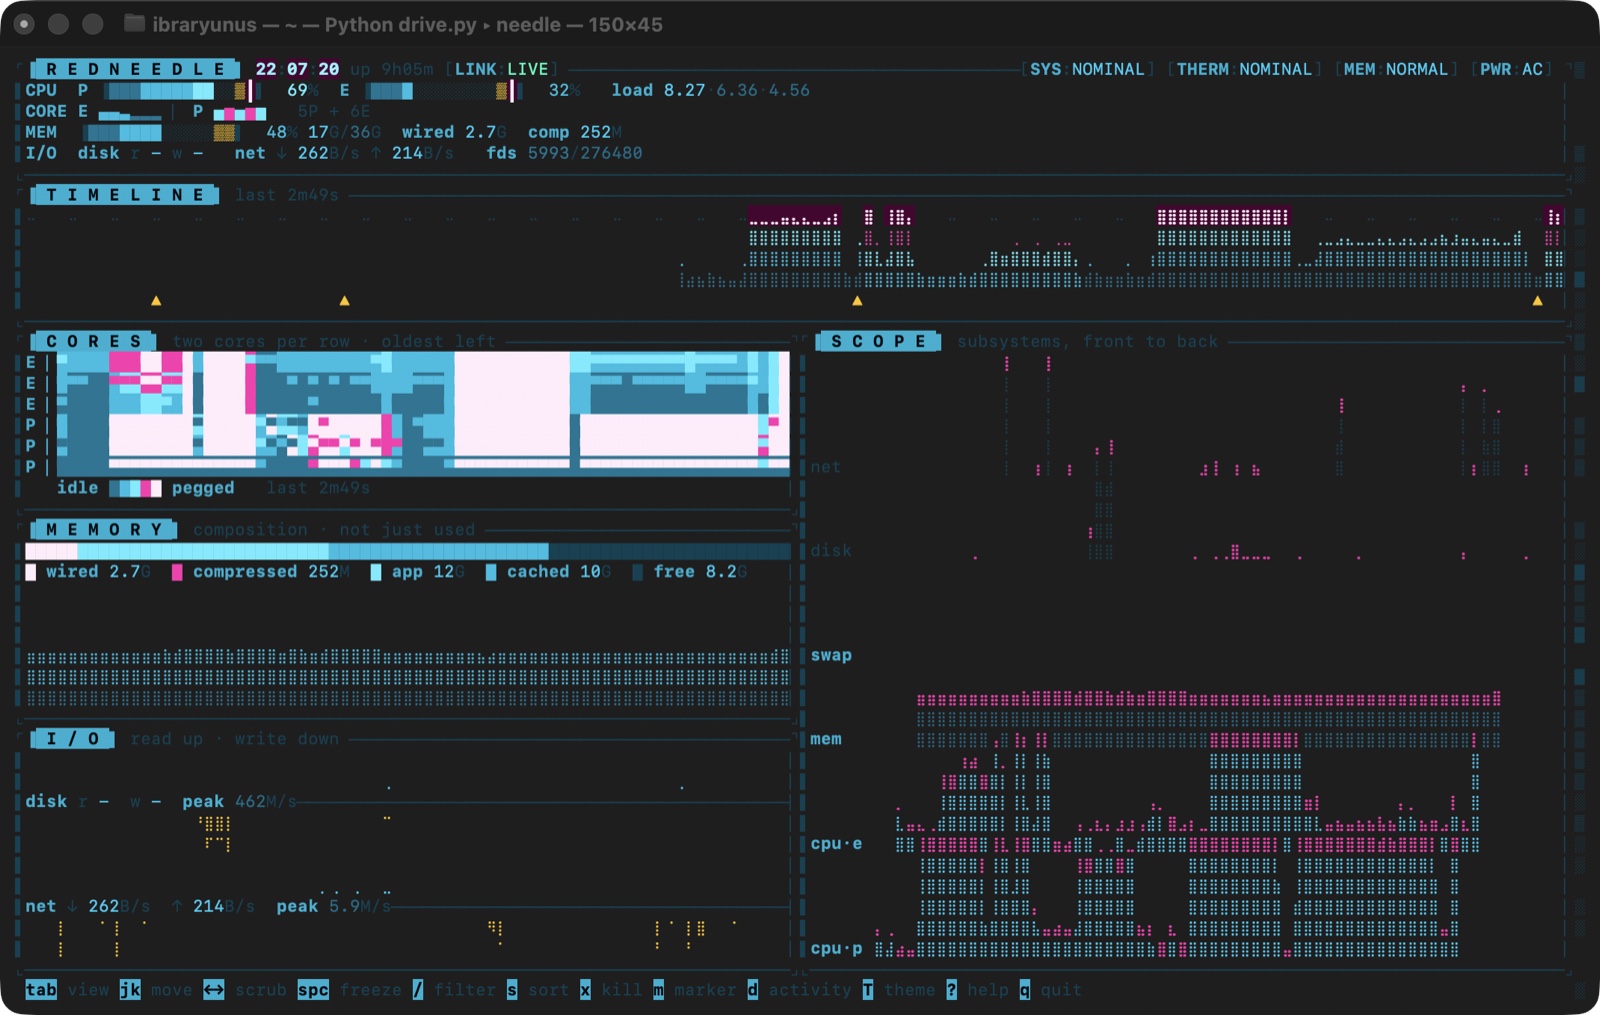
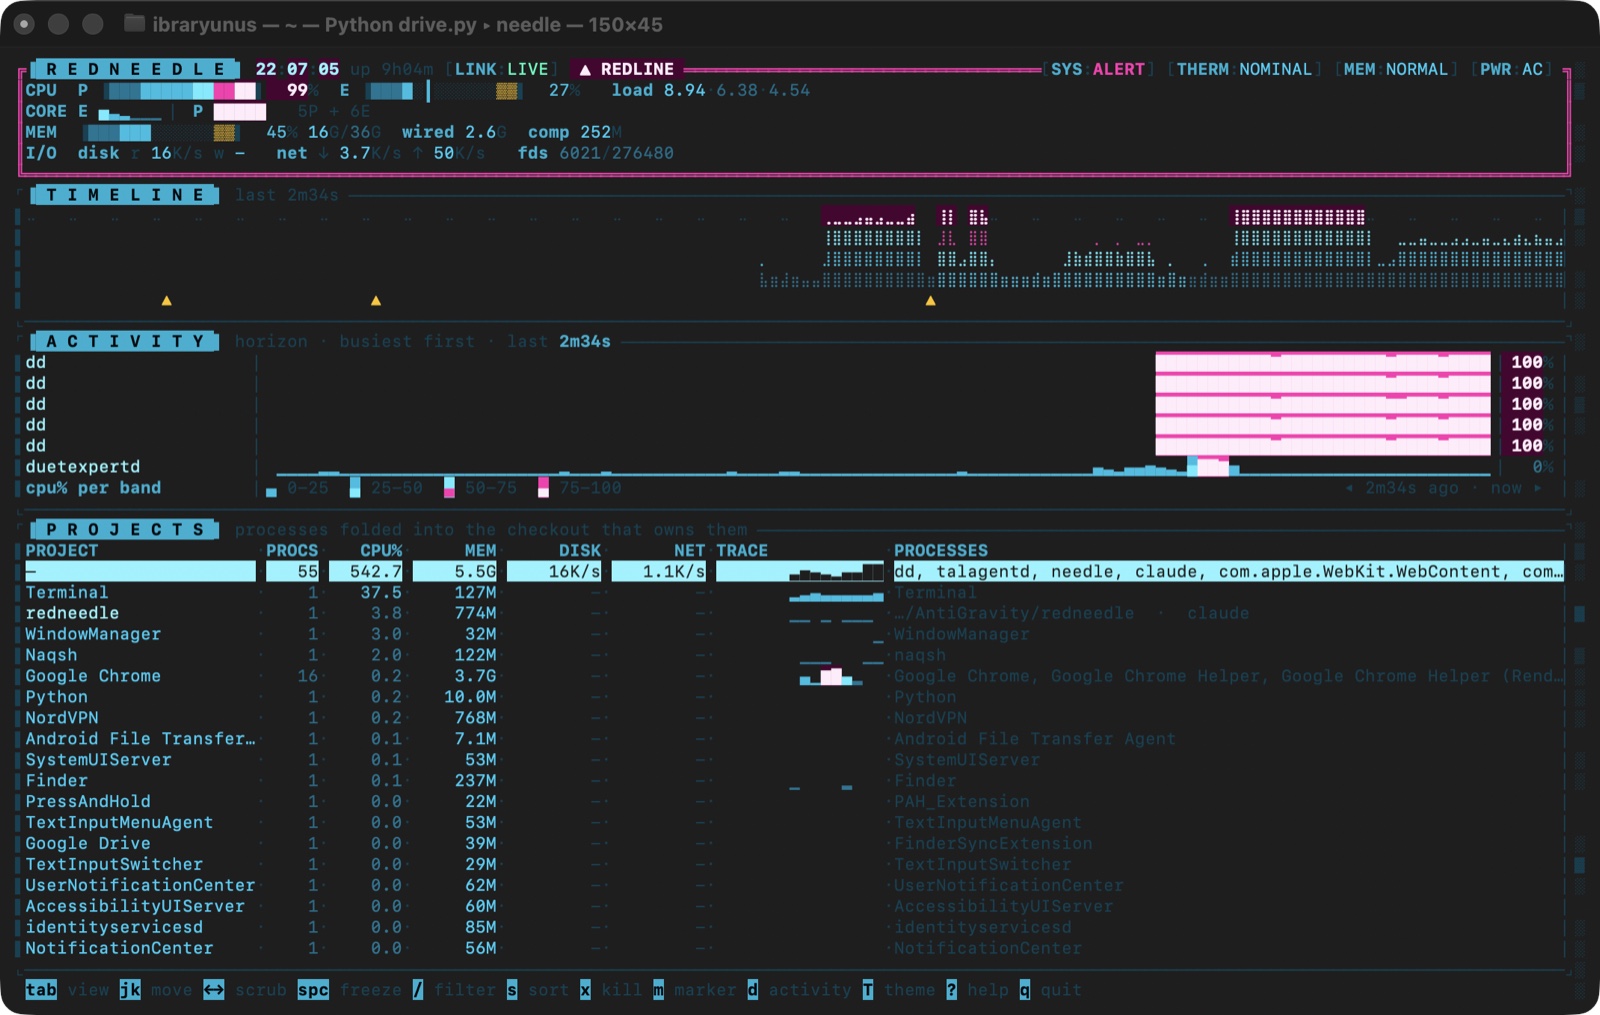
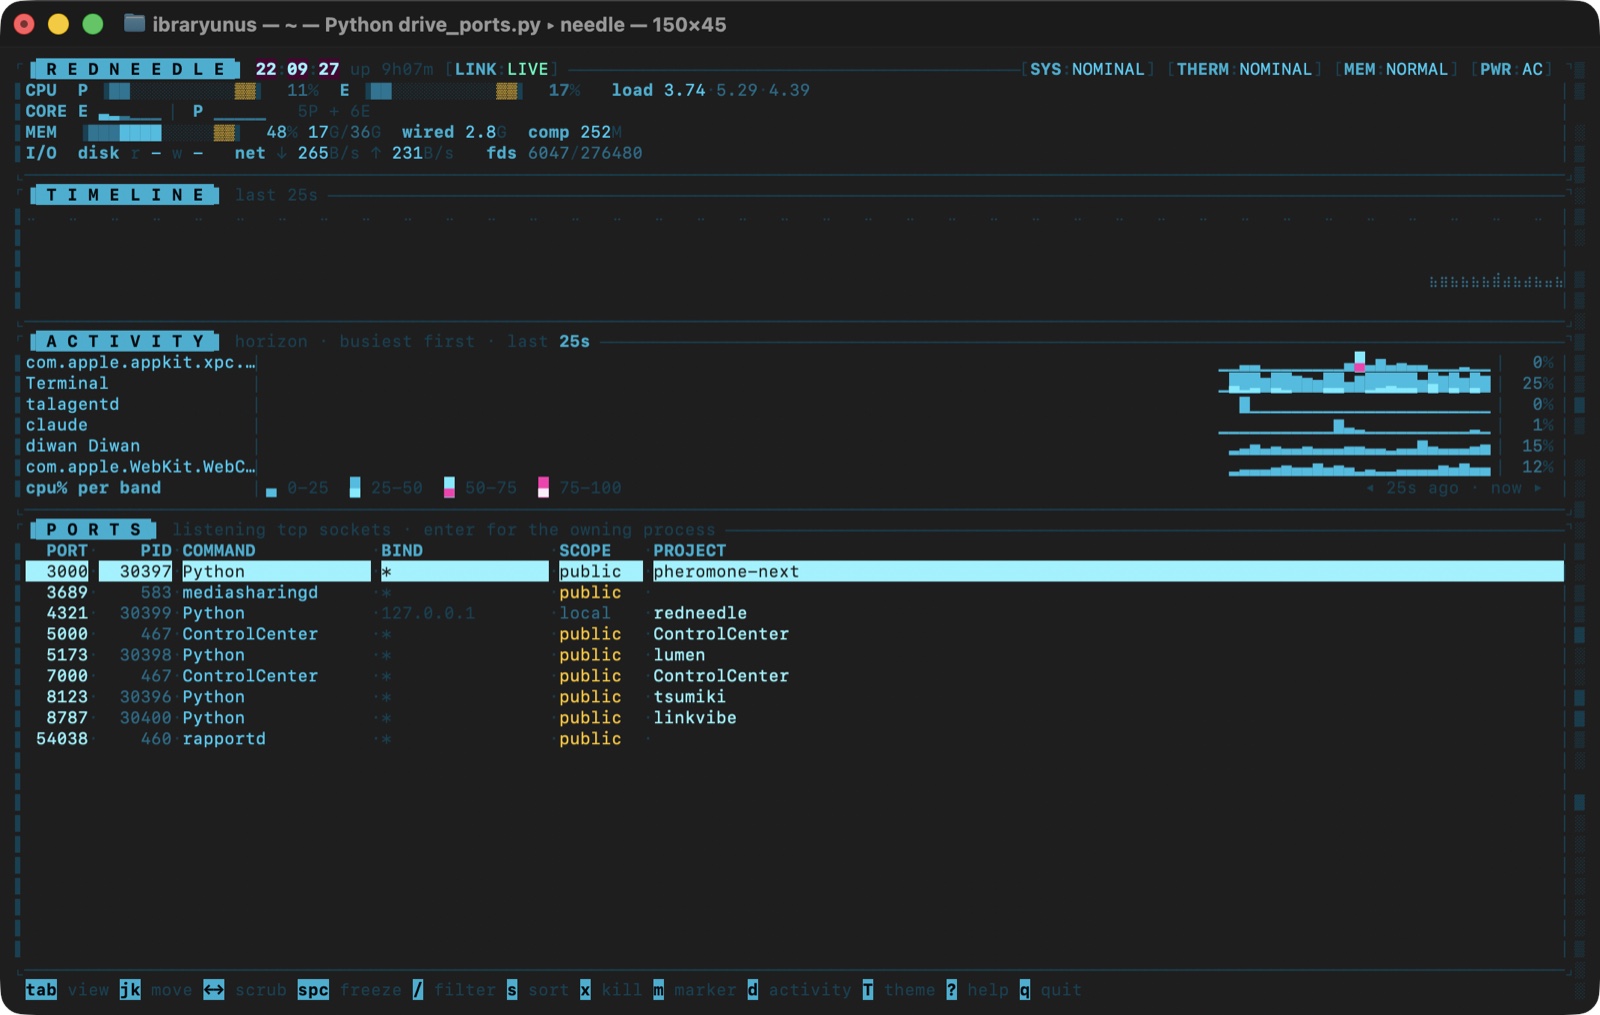
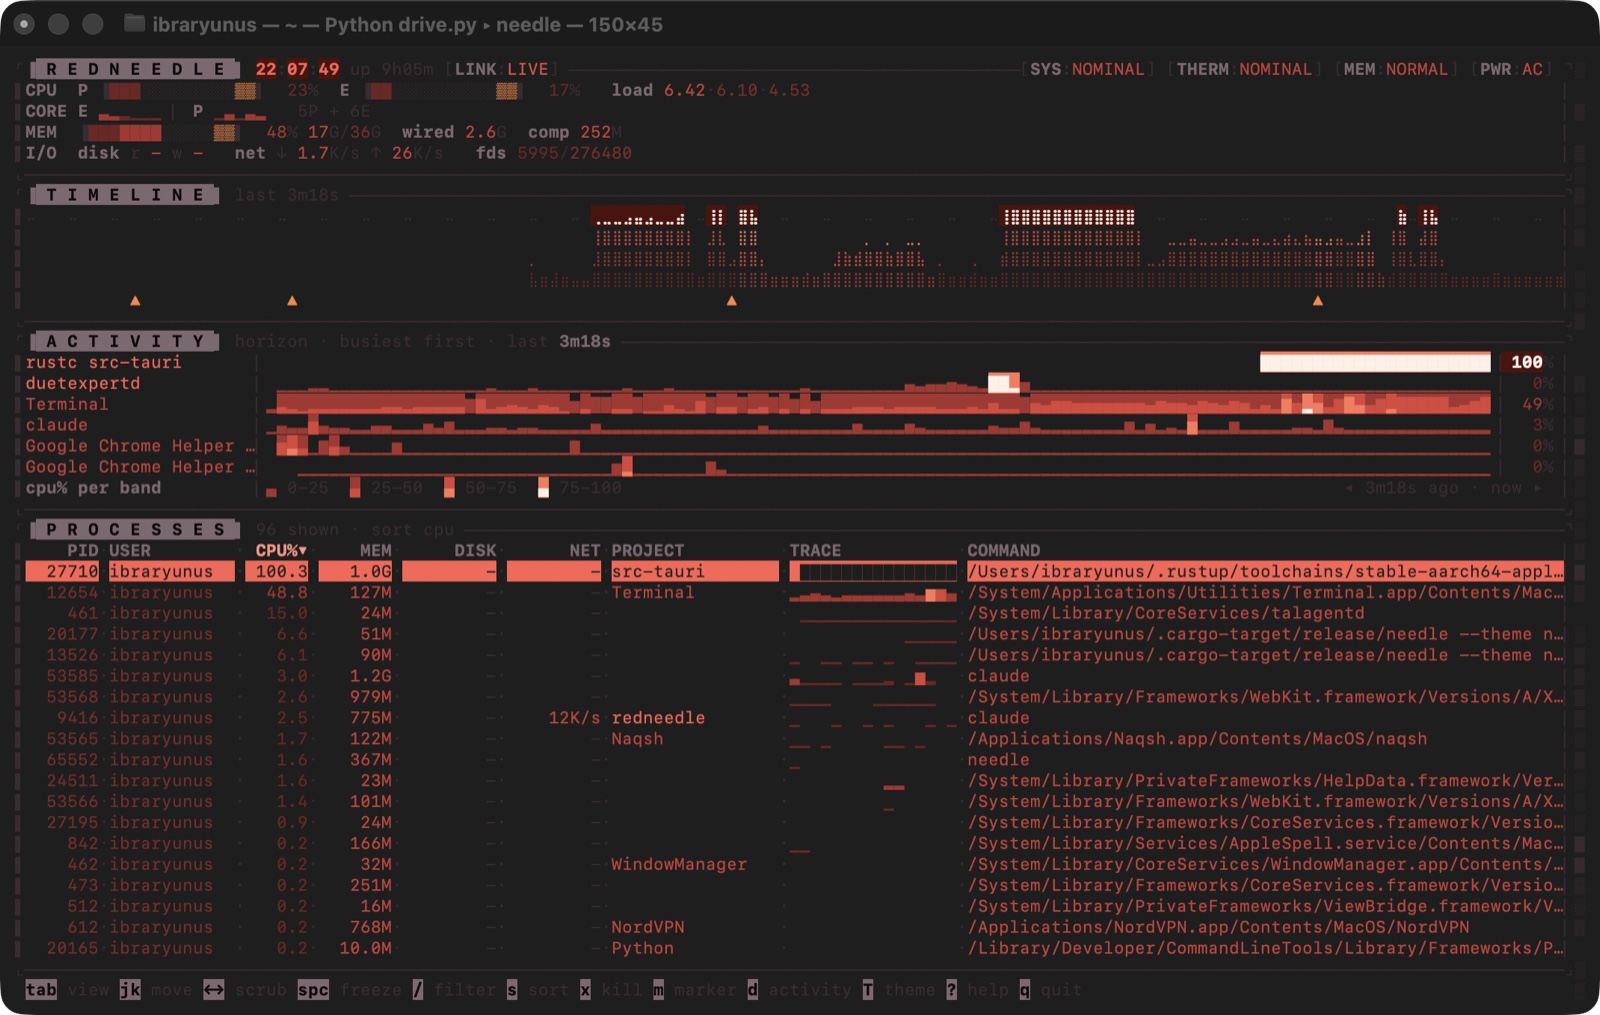
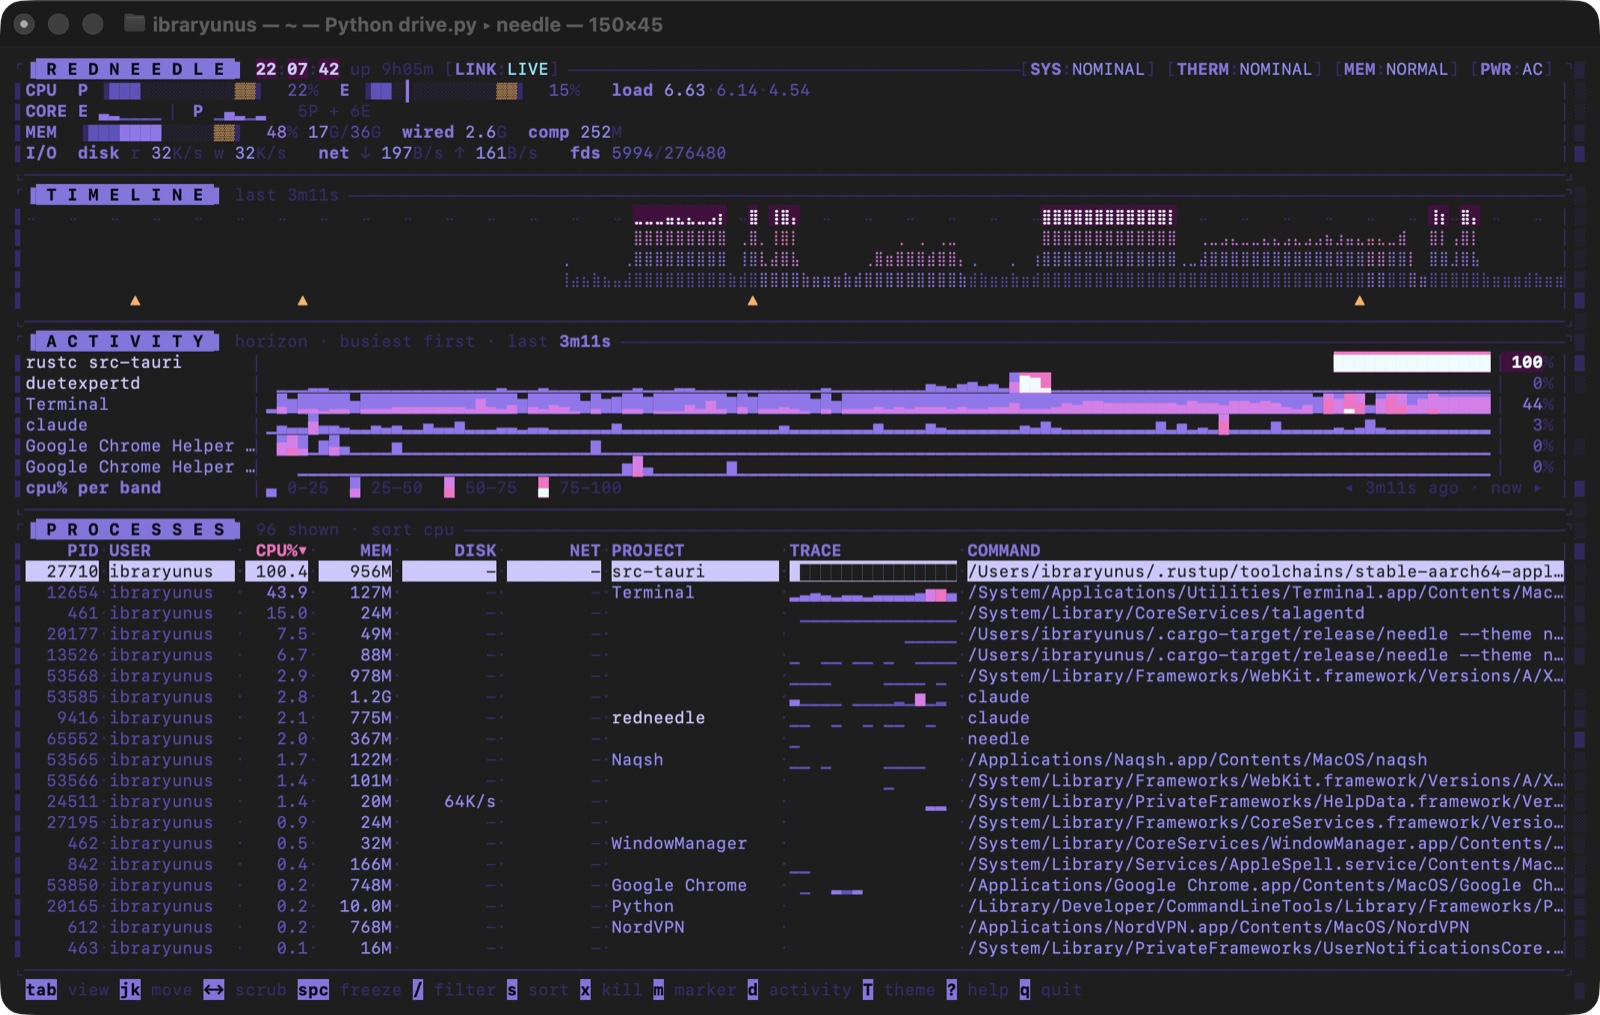
The rule that shaped the whole thing is that the most useful fact about a spike only exists during the spike. Everything else follows from taking that seriously: keep every sample, attach the culprit to the marker at the instant it is raised, and mark a scrubbed frame as a recording so it can never be mistaken for a live reading. The name is a small piece of the same honesty: redline was the obvious one and is unusable, because it already belongs to a host-forensics product and to one of the better-known infostealer families, both of which do process and memory inspection. A monitor that shares a name with malware in the same space is a monitor nobody should install.
What It Does主な機能
A Timeline You Can Scrub
Every sample is kept — thirty minutes by default. ← and → walk backwards and the whole UI re-renders as it was at that instant, process table included; space freezes, home returns to live. A process that appears in a scrubbed frame but has since exited has its command line degraded into static, because what you are looking at is a recording rather than a reading and the table should say so without a legend.
Markers With a Culprit Attached
When CPU crosses the redline, thermal pressure changes, memory pressure changes, the machine starts swapping in, or file descriptors approach the kernel limit, redneedle writes a marker at that instant along with the process responsible. After the fact that process is usually gone — this is the only moment the information exists. m and M jump between them.
P-Cores and E-Cores Kept Apart
On Apple Silicon a pegged efficiency cluster is a healthy idle and a pegged performance cluster is not. One averaged CPU number cannot tell the two apart, so the header carries them as separate gauges and the scope draws a core waterfall — two cores per terminal row, upper in the foreground of a half-block and lower in its background — because four cores pinned and seven idle averages to the same figure as everything at forty percent, and the two mean completely different things.
Memory Pressure, Not Used
macOS compresses and caches aggressively, so 22 GB used means nothing. redneedle reads the kernel's own pressure level, breaks memory into wired · compressed · app · cached · free ordered by how hard the page is to get back, and shows swap-ins per second — the number that actually correlates with the machine feeling slow. Thermal pressure gets the same treatment: a visible, recorded signal for “you are being throttled”, which explains more slow builds than any CPU graph.
Processes Folded Into the Checkout That Owns Them
Each process's working directory is walked up to the nearest repository root, so a table of anonymous node and rustc entries becomes a list of projects. Chrome's forty helpers collapse into one row too, because .app bundles fold the same way. It is the difference between a list of processes and a list of the things you are actually doing.
Ports, First Class
A permanent view of every listening TCP socket, the process holding it and the project it belongs to — and whether the bind is reachable from outside this machine or only from localhost, which is worth knowing about a dev server. needle ports prints the same table and exits.
The Activity Horizon
Between the timeline and the process table sits a horizon chart, the technique for many series and almost no vertical space. The value range folds into four bands stacked into a single row: colour says which band the value reached, glyph height says where inside it. Eight processes cost eight rows and still resolve to about a thirtieth of the range. Lanes are ordered by each process's peak over the window rather than by what it is doing this second — a chart whose rows move while you read it is unreadable however good the encoding is, and peak keeps whoever has just gone quiet on screen, which is usually the process you went looking for.
needle run — What That Build Actually Cost
needle run -- pnpm build runs the command with stdio attached as normal, then reports wall time, peak CPU against what the machine has, cpu-time as cores busy on average, peak memory across the whole process tree, disk read and written, whether the machine was thermally throttled at any point, and core-seconds broken down per binary. Two of those answer questions nothing else will: cores busy on average is parallel efficiency — if -j 10 gives you 3.4, the flag is not doing what you think — and thermal tells you whether the build got slower or the machine did. The report goes to stderr, so stdout still belongs to the command.
Seven Themes, One Instrument
neon, acid, vapor, red, ember, mono and classic, cycled live with T. The cycle runs brightest to quietest so one keypress moves along a gradient rather than jumping about, mono is the automatic choice under NO_COLOR, and gradients use 24-bit colour when COLORTERM advertises it and hand-picked 256-colour indices otherwise rather than letting the terminal approximate them badly.
Changelog変更履歴
- +A frozen screen stays frozen: the scrub cursor was an index into a buffer that slides, so once the 30-minute history filled up, a frozen or scrubbed display silently played forward until it caught up with live.
- +enter opens the process behind the selected row in every view — in the ports view that is the socket's actual owner, not whichever process sat at the same row number.
- +Signals are aimed with the live sample rather than the frame on screen, so a process that has already exited — and whose pid the kernel may have recycled — cannot be signalled from a scrubbed frame.
- +needle run passes the command's real exit status through (128+N for a death by signal, 127 for a command that could not start), measures wall time to the exit rather than to the end of its own sampling, writes --json to stderr so stdout still belongs to the command, and survives ctrl-c: the signal is passed on, the child is reaped, and the partial measurement is still reported.
- +CPU totals now count the short-lived steps a sampler never sees, taken from the kernel's own child accounting — a build made of hundreds of sub-100ms steps was losing most of its time.
- +Thread counts are real rather than always zero, a battery held at 80% no longer reports as charging, a failed nettop sweep no longer pins stale rates to a process, and CJK process and project names no longer shift every column to their right.
- +Scrubbable 30-minute history — the whole UI, process table included, re-renders as it was at any second in the window.
- +Event markers for CPU redline, thermal pressure, memory pressure, swap-in and file-descriptor headroom, each carrying the process responsible at the instant it was raised.
- +P-core and E-core gauges kept apart, memory composition and kernel pressure level rather than "used", thermal pressure and fd headroom.
- +Projects view — processes folded into the checkout that owns them; ports view — every listening TCP socket with its owner, project and whether the bind is public.
- +needle run -- <cmd> reports wall, peak CPU, parallel efficiency, peak memory, disk, thermal state and per-binary core-seconds.
- +Activity horizon chart, the four-panel scope, seven themes, and snapshot / json / ports modes that work over ssh and in CI.
Where It Stands現在地
redneedle v0.1.1 is published and installable in one line: brew tap ibraryunus/redneedle then brew install redneedle pulls a Developer-ID signed, Apple-notarized binary — the source stays closed, and the tap carries no code. The deliberate gap is GPU, Neural Engine and wattage, which need root-only powermetrics and therefore a privileged helper; the collection seam is already in place, so that stays a trade-off rather than a rewrite. The natural next steps are configurable alert thresholds and exporting a scrubbed window as a shareable artefact — the history is already structured data, so both read from what is there rather than adding new machinery.
Rust 2024 on ratatui and crossterm, about 6,000 lines, shipping as a single binary called needle. Readings come from where they actually live rather than from a shell-out: core topology from hw.perflevel0/1.logicalcpu, the memory breakdown from host_statistics64(HOST_VM_INFO64), memory pressure from kern.memorystatus_vm_pressure_level, thermal pressure from OSThermalNotification via notify_get_state, and fd headroom from kern.num_files against kern.maxfiles. The two things that genuinely need an external tool — lsof for listening sockets every 3s and nettop for per-process network every 2s — run on their own threads, so a sample is never blocked behind them, and both degrade silently to an empty panel if the tool is missing. GPU, Neural Engine and package wattage all require powermetrics, which is root-only; redneedle ships without a privileged helper so that one brew install is the whole setup, and the seam is left in place if that trade ever stops being worth it. Rendering is deliberately testable: the TUI is drawn through ratatui TestBackend in the suite, so layout, key handling and scrubbing are all covered without a tty, and the startup settle and view transitions are a post-pass over the finished frame rather than a separate render path — an animation that cannot drift away from what the UI actually looks like. The event loop paints at 40 ms while anything is moving and drops back to 100 ms when nothing is. Per-process CPU is sampled, so a process born and gone inside one interval is invisible in the live table; needle run works around that by diffing lifetime CPU time instead, which is what makes short-lived build steps count.